Empirical methods are frequently applied for support prediction in underground construction, with engineering rock mass classification carried out as the basis for support estimation. Many parameters used for the rockmass classification are common in these methods. However, applicability of these methods has always been a subject of discussion (Bieniawski, ’97, Palmstrom et al, ’01, Barton, ’01, and Palmstrom et al, ’02).
An attempt has been made on comparative use of three empirical methods for rockmass classification and support prediction for a tunnel as a part of Dr ing course at the Department of Geology and Mineral Resources Engineering, NTNU, Norway. Professor Nilsen co-ordinated a study team comprised of four experienced Dr ing students. Before fieldwork, the four participants were briefed on parameter evaluation, so that the same procedure was followed and consistency was maintained in quantification. The fieldwork, rockmass classification and support prediction were carried out independently with lab tests carried out jointly.
One of the focuses of this article is the variation in the parameter evaluation due to different observers – i.e. reproducibility. However, the methods employed in this regard, involve many parameters. Therefore only the parameters with a significant amount of variation and good reproducibility are discussed here.
Site location
Rock support has been estimated for a 6km long, 8.5m wide road tunnel proposed as an alternative route to a section of the existing Rv 715 Bynesveien road. The same rock mass qualities found for the exposed rock are assumed along the 200m deep tunnel alignment.
Field parameters were evaluated for Trolla quarry and Folafoten rock outcrops located along the road (Figure 1). Two sites were studied at Trolla and one at Folafoten in September 2002. Rock mass at Trolla consisted of granodiorite, a coarse-grained plutonic rock intruded into the Trondheim volcanic rock. Of the two study sites, the eastern rockmass site was fresh to slightly weathered with less to moderate jointing and the western site was fresh and blocky in nature. Parameters were evaluated for all three classification methods. One boulder was collected for the lab.
The Folafoten site consisted of greenschist with chlorite, a low-grade metamorphosed basic igneous rock. Occasional lava pillows occur in the heavily jointed rock mass that was moderately weathered. Two boulder samples were collected for lab testing. Uniaxial compressive strength (UCS) tests of intact rock material were carried out on three cores of 32mm diameter and 80mm length, for each site. UCS Lab test results, adjusted for 50mm dia cores, were 74MPa for Trolla granodiorite and 87MPa for Folafoten greenschist.
Evaluation of field parameters was carried out by correlating the field condition with the respective description given in the method table. Representability defines how closely the field condition is represented by the parameter description. A numerical rating value is assigned to each parameter.
When the field condition best fits with the parameter description, parameter evaluation will be convenient and similar rating values can be obtained for the same parameter by the different observers i.e. the reproducibility. Otherwise there will be variation in these rating values. Proper representability and good reproducibility of parameter rating values justify the applicability of the respective empirical method.
RMR results
Of the 10 parameters, five showed variation. These were Discontinuity separation, Discontinuity infilling, Discontinuity weathering, Groundwater and Orientation. Two showed good reproducibility, these were RQD and Discontinuity roughness.
The Groundwater parameter consists of prediction of groundwater condition, subject to variation during observation. Though there was no water flow in the observed Folafoten rock outcrops, prediction for the planned tunnel varied from completely dry to dripping, giving significant variation in rating values. Because of the chlorite in greenschist, some observers did not expect water during construction. However, some did, as the rock was jointed. No particular reference was used to quantify rating value for orientation. Separation, infilling and weathering of discontinuity also varied in a short distance in all the direction. So all the observers considered a different typical condition and hence variation in rating values (Figure 2).
Discontinuity roughness parameter consists of observation of roughness of discontinuity surface. All the five observers came up with rating value 1 for the greenschist, as its field condition fits with one of the parameter descriptions with slickensided condition. But rating values for this parameter did not agree for the granodiorite. Similarly, good reproducibility was observed in the RQD rating value with magnitude 20 for the granodiorite as it had fewer joints per/m.
Q-system results
Of the six parameters, RQD and Jn, show the significant variation and Jr shows good reproducibility in rating values. An interesting aspect to notice in RQD and Jn, is the difference in variation nature that depends on the rock mass type. Rating values for these two parameters vary significantly for the greenschist which is more jointed than the granodiorite rocks. RQD value was calculated from the number of joints per/m³ (Jv) and using the following equation (Palmstrom, ’82):
RQD = 115 – 3.3 Jv
As the Folafoten rock was more jointed, there was variation among observers in determining the number of joints per/m³. Similar reason prevailed in defining the regular and random joint sets for Jn values (Figure 3).
All the observers found the same rating value 1 for Jr for the least jointed rock mass.
RMi results
Of the five parameters, Block volume (Vb) shows significant variation and Joint alteration factor (jA) shows good reproducibility in rating values. As Folafoten rock was more jointed, all the blocks were different sizes. So it is subject to potential variation whilst determining the volume of the typical rock block (Figure 4).
One of the parameter descriptions for jA, given in the table very nicely co-relates with the field condition for greenschist with chlorite in joint. So, all the observers came up with the same rating value 4 for jA.
Comparisons
A review of the findings of the field parameter evaluation, lab results, classification values and support predictions led to a discussion on convenience in field parameter evaluation,
variation in parameter rating values, and comparison of rock mass classification values and amount of support estimation.
While using each of the three methods, all the five participants had difficulty in co-relating a few of the field parameters with its given description. It happened with some of the parameters with variation in rating values. Overall, they experienced similar degree of ease in field parameter evaluation while using all three methods.
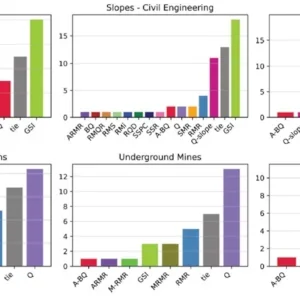
In order to compare the rock mass classification values, a graph has been plotted for each method with values in ascending order. The graph shows that RMR is less sensitive to the variation in the parameter rating values. Except for the granodiorite at the East, the resulting overall RMR ratings place all the rock types in the same category (Table 1).
The Q system is found to be sensitive to the variation in parameter rating values. The variations have changed the Q value enough to move all the rock types from one class to other, even from the bottom of the one class to the top of the next higher class or vice versa (Table 1).
The RMi method is found to be sensitive for the less jointed rock mass. The variations have changed the RMi values sufficiently to move the granodiorite (West) from discontinuous to continuous category (Table 1), whereas it places the other two rock types in the same category. One useful aspect that is noticed in the RMi method, is characterisation of the rock mass in terms of continuity, which assists in assessment of stress induced problems. Thus it might be a good idea to use the RMi method if the rock mass is suspected to be subject to stress problems.
The rock mass classification value is a function of many respective parameters. However, it can be observed in all the three graphs (Figures 5, 6 and 7) that variation in the classification values is not enough to cross any curve by the other. So all the three methods are qualitatively similar. Most of the participants felt confident in the RMR and RMi classification systems because they also consider rock strength parameter. However, they were sceptical to the RMi method as it does not include groundwater parameter.
Comparison of the supports predicted by the different methods (Table 2) shows that the support amounts are not differing much from each other. All the participants agreed that the Q support chart is the most convenient to predict the tunnel support.
Conclusions
Convenience and good reproducibility are the main factors justifying the applicability of empirical methods. The methods here are similar in terms of convenience in field parameter evaluation. However, some parameters of each method have relatively high variation in rating values among the different observers. The adverse effect of these variations can be minimised by providing rating value in range rather than with a single value. In this study, the Q-system has been found more sensitive to variation in parameter rating values than the other two methods.
Although differences have been identified in the quantification of certain input parameters, the resulting rock mass classification values of each of the three locations are similar, and the tunnel supports estimated by the three methods are similar in quantity and type. In this case, the Q support chart was considered to be the most convenient for estimating tunnel support. The Q-system was also considered to be the most simple to use since it was based on field mapping only, and did not require laboratory testing as the RMR and RMi methods do (unless for cases with potential stress related problems, where the Q-system like RMR and RMi requires input concerning rock strength).
The main conclusion of this study is, despite the basic differences between the three different methods, and some significant variations among the five different observers in the estimation of individual parameter, the rock mass classifications and support estimations have been found to be quite similar. Although this study does not intend to be an overall evaluation of empirical systems for rock mass classification, the study illustrates that such systems represent useful tools for characterisation of rock mass quality and planning of support design for underground excavations. Several of the input parameters of such systems, such as Jw and SRF of the Q-system, are however often difficult to quantify at the planning stage. It is therefore warned against using such a system as the only tool.
Related Files
Figure 4 – Variation in RMi method rating values
Figure 2 – Variation in RMR method rating values
Figure 5 – Sensitivity of RMR values
Figure 7 – Sensitivity of RMi values
Figure 3 – Variation in Q-system rating values
Figure 6 – Sensitivity of Q-values
Figure 1