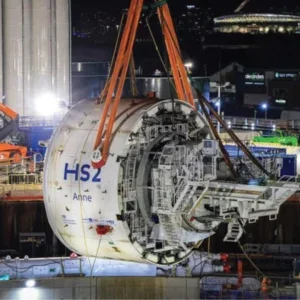
The UK’s Channel Tunnel Rail Link (CTRL) project involves the construction of 35km of 8m diameter tunnels under London. Tunnelling in soft ground is usually accompanied by not-insignificant ground movements. In selecting the CTRL tunnel alignment, care has been taken to minimise interaction with overlying structures. However, as the tunnels are being constructed under highly built-up areas, they could influence a number and variety of surface structures. By controlling tunnelling-induced ground movements to acceptable values using advanced TBMs, tunnelling can proceed safely under most structures without detrimental effects. Figure 1 shows a cross-section of the two CTRL running tunnels underneath piled foundations of a bridge in East London. Before tunnelling can proceed, it is essential that its influence on the piled bridge be understood so that mitigation measures can be instituted to control possible adverse effects.
Several methods are available for the determination of greenfield tunnelling-induced surface and sub-surface ground movements(6,8,9) and considerable work has been done on the prediction of the effects of tunnelling-induced ground movements on overlying structures(1,7). There is however little information on the effects of tunnelling on piled foundations, reflecting a limited understanding of this complex soil-structure interaction problem. In order to shed some light on this, a study has been carried out at Cambridge University in which the problem was investigated by means of centrifuge modelling(3).
Model description
The centrifuge model developed to investigate the effects of tunnelling on piled foundations is illustrated in Figure 2. All tests were carried out at an acceleration of 75g, modelling a 4.5m diameter tunnel at a depth of 21.5m at prototype scale.
The model tunnel and piles were surrounded by dense (relative density of 75%) dry fine silica sand pluviated from a hopper at constant height and flow. The model was assembled in a box measuring 750mm x 400mm x 470mm deep, equating to 56m x 30m x 35m deep at the prototype scale. Two circular openings in the sides of the box accommodated the model tunnel. The 60mm dia model tunnel consisted of a brass tube surrounded by a 1mm thick latex membrane. A 4mm thick annulus between the tube and membrane was filled with water that could be extracted to simulate volume losses from 0% to 20%.
Segmental instrumented model piles, each equipped with six axial load cells along their lengths (Figure 2), were used to examine effects of volume loss on the pile load distribution. One instrumented pile was also equipped with five stress cells to measure normal stress changes on the pile shaft. The o.d. of the piles was 12mm (900mm at prototype scale) over a 250mm length (18.75m at prototype scale). The total length of the piles was 360mm, with the upper 110mm unmachined and bases fitted with 60° conical tips.
The piles were kept loaded by brass weights, sliding over the unmachined upper sections of the piles. The loads were sized to exert a load equal to roughly 50% of the piles’ penetration resistance. The service loads scaled to 5800kN per pile at the prototype scale.
In all tests, piles were installed with their bases to depths above the tunnel as shown in Figure 2. During model preparation the model piles were jacked into the sand to 25mm above their final depths. Pneumatic actuators push down on the weights resting on the piles to drive the piles to their final depths in flight (i.e. at 75g), before inducing volume loss. The actuators were then retracted leaving only service loads acting on the piles. Load cells in the service weights, enabled the load transferred to the piles to be monitored at all times.
The pile settlements were monitored using Linear Variable Differential Transformers (LVDTs), resting on the service weights. Surface settlement was monitored with an array of seven LVDTs. Subsurface settlements were monitored at the depth of the pile toes using miniature extensometers(3).
Single pile settlement
Figure 3 illustrates the settlement of the sand surface and a pile at an offset of 50mm (0.83D) from the tunnel centreline installed to a depth of 250mm, with volume loss. Initially the settlements were not dissimilar, but at 1.3% volume loss the pile settlement accelerated rapidly, exceeding the surface settlement. Large pile settlement rapidly followed with further volume loss. By carrying out a number of centrifuge tests with the pile bases installed to different locations, a zone of influence near the tunnel was identified in which a potential for ‘large’ settlement (in excess of 20mm at prototype scale) exists above 1.5% volume loss.
The zone of influence can be sub-divided into zones A, B and C (Figure 4), depending on the amount of settlement that the piles underwent relative to the surface at 1.5% volume loss. Zones B and C are separated by lines initially rising at a slope of 45° + f‘/2, i.e. the slope where a slip surface could develop. Zone C is a transition zone between zone B and the zone where pile settlement is negligible (zone D). Tentative outer boundaries for this zone, based on the centrifuge tests, initially rising tangentially from the tunnel at a slope of 45°, are shown. The zone of influence narrows towards the surface. When extrapolated, it appears that the zone of influence intersects the surface at an offset of roughly 2i from the tunnel centreline, where i is the distance from the tunnel centreline to the point of inflection on the surface settlement trough.
Piles with their bases in zone D always settled less than the surface, while the settlement of piles in zone C was similar to the surface settlement. At 1.5% volume loss, piles with their bases in zone B had settled more than the surface and subsurface, while pile settlement was similar to surface and subsurface settlements (measured with mini-extensometers) in zone A. Pile 2 (Figure 4), close to the tunnel, suffered large settlement at only 0.5% volume loss. Piles with their bases installed in zones A and B underwent a sudden acceleration in the settlement rate at a certain volume loss, while the settlement of piles installed in zone C occurred more gradually with volume loss.
The volume loss at which pile settlement accelerated rapidly (critical volume loss) was strongly dependent on the location of the pile base with respect to a line extending upward from the tunnel springline at a slope of 45° + f‘/2, the line separating zones B and C. Small variations in pile base location had quite an influence on their behaviour, i.e. piles with their bases extending below the 45° + f‘/2 line showed considerably higher critical volume losses than shallower piles.
Load changes on single piles
Figure 5 presents the normalised pile base loads at volume losses from 0% to 5% for single piles installed around the tunnel. The base loads were normalised by the base load value after retraction of the pile driving actuators, prior to volume loss.
Piles 1 to 4 (see inset in Figure 5), with their bases inside sub-zones A and B of the zone of influence, suffered considerable reductions in base load during volume loss, while Pile 5 in sub-zone C suffered a significantly smaller base load reduction. Base loads on Piles 6 and 7 in zone D remained roughly constant. As constant loads were imposed on the piles, the loss of base load resulted in positive shaft friction being mobilised on piles that had their bases within the zone of influence. Small amounts of negative shaft friction developed on piles with bases outside the zone of influence (zone D), as the sand settlement around shafts exceeded the pile settlement.
Tunnelling causes a reduction in the mean stress level in the adjacent ground, requiring much stress redistribution to maintain equilibrium. This reduction causes the magnitude of the large stresses occurring below pile bases to reduce. Figure 5 shows that the rate of base load reduction within sub-zones A and B of the zone of influence varies depending on the distance and location of the pile base relative to the tunnel.
The rates of base load reduction were initially approximately linear with volume loss, but began to reduce as the maximum shaft capacities were approached.
The retraction of the actuators, after pushing the piles to their final depths, was accompanied by slight pile rebound, reducing mobilised shear stresses on the pile shaft. The piles were therefore essentially end-bearing, with low mobilised shaft loads prior to volume loss, so that they initially had significant reserve shaft capacity.
Figure 6 presents the pile load percentage carried on the pile shaft against pile settlement for piles installed at various tunnel locations. Small positive shaft friction values were initially mobilised on Piles 1 and 2 in zones A and B of the zone of influence, while larger negative shaft friction values were initially recorded on the Piles 5 and 6 in zone C and D. Lower penetration resistances were recorded during pile driving in zones A and B due to the proximity of the flexible model tunnel, with higher resistance in zones C and D.
Shaft friction rapidly mobilised with pile settlement on piles with their bases in zones A and B (Piles 1, 2 and 3). Pile 5, installed in zone C, underwent a much more gradual reduction in negative shaft friction, suggesting that the pile settlement must have been similar to the settlement of the surrounding sand. Negative shaft load values initially increased somewhat on Piles 6 in zone D due to downward movement of the sand around the piles, followed by a slight reduction.
The shaft loads on Piles 1 and 2 directly above the tunnel (zone A) soon reached a constant value, beyond which pile settlement occurred under a constant load distribution. Beyond the initial friction mobilisation on Pile 3 in zone B, the shaft load continued to increase gradually with volume loss related settlement. Zone B roughly coincides with the zone of most intense shearing that extends upward from the tunnel springline or shoulder during volume loss(2). The gradual increase in the mobilised shaft capacity with pile settlement could therefore reflect a continuous increase in the normal stress on the pile shaft, resulting from dilation caused by progressively more intense shearing in this zone.
Figure 7 presents normal and shear stresses on the bottom segment of Pile 2 with settlement. The settlement was initially due to pile driving and after partial unloading, due to volume loss. The normal and shear stresses remained constant over the increment of settlement shown during pile driving. Stresses reduced considerably during the retraction of the pile driving actuators as the pile rebound. During pile settlement caused by volume loss, the stresses were again rapidly mobilised and reached values slightly higher than those recorded during pile driving. The increase in normal stress on the pile shaft during pile settlement is caused by dilation on the soil-pile interface(5) and has been modelled by various researchers using cylindrical cavity expansion(4). The higher shaft capacity during volume loss reflects the increase in horizontal (circumferential) stress above the tunnel due to stress redistribution associated with volume loss. This increased capacity rapidly reduces along the length of the pile upwards from the tunnel.
Tunnel-induced pile settlement
Tunnelling-induced subsurface settlement increases with depth above the tunnel axis. It might seem intuitive that the downward movement of material in contact with a pile installed above a tunnel will induce negative friction on the shaft. However, negative shaft friction can only be sustained if it can be balanced by an increase in the base load, or by the development of tension in the pile. A pile under tension would be supported by positive shaft friction along the part of the pile shaft closer to the surface and would carry no base load.
In the centrifuge tests the base loads on piles with bases close to the tunnel reduced rapidly with volume loss, forcing mobilisation of positive shaft friction along the entire length of the pile shaft. Tension did not develop as there was always some load on the base, causing the entire shaft to be in compression. If positive friction was mobilised along the entire pile length, the settlement of soil surrounding the pile could not have exceeded the pile settlement.
At volume losses below 1.5%, pile settlement within the zone of influence was found to be very similar to the surface settlement. It appears that realistic estimations of pile settlement can be made using the greenfield surface settlement at the pile location. However, for piles with their bases inside sub-zones A and B of the zone of influence this is only permissible up to the volume loss at which the pile shaft capacity has been fully mobilised. This volume loss is not known. Once the pile settlement has been estimated it is necessary to check whether the maximum volume loss, for which this approach is valid, has not been exceeded.
Figure 5 might be used to obtain an indication of the amount of base load reduction that piles at various locations might undergo at a certain volume loss. This data however applies strictly to piles in dense sand, initially possessing significant reserve shaft capacity. The amount of reserve pile shaft capacity might be estimated by carrying out a redesign of the pile. This should be useful in judging the initial load distribution on the piles. As piles are often designed with large factors of safety, many should have considerable reserve shaft capacity. Should the likely base load reduction be less than the reserve pile shaft capacity, pile settlement can be modelled safely by the greenfield surface settlement. Should this not be the case, measures have to be instituted to mitigate against excessive pile settlement, or alternatively, volume loss has to be controlled.
Conclusions
A zone of influence was identified around a tunnel in dense sand in which a potential for large pile settlements (in excess of 20mm at prototype scale) exists at volume losses exceeding 1.5%.
As volume loss increased, the base loads of piles with their bases installed in the zone of influence reduced, increasing the mobilised shaft loads. This was accompanied by very little pile settlement. Once the maximum shaft capacity had been mobilised, further volume loss (and hence base load reduction) resulted in rapid pile settlement. The onset of excessive pile settlements with respect to volume loss may be rapid.
Piles outside the influence zone did not suffer a base load reduction and suffered only small settlements attributed to a small increase in negative shaft friction and consequent small increase in end-bearing.
The piles in the tests described in this paper possessed significant reserve shaft capacity due to the rebound that they underwent when the pile driving actuators were retracted. Should the amount of reserve shaft capacity have been less, more rapid pile settlement (i.e. settlement at smaller volume losses) might have occurred. It is therefore important to have an understanding of the present load distribution on piles if the effects of nearby tunnelling are to be assessed.
In general, based on the centrifuge results, it appears realistic to model pile settlement with the corresponding greenfield surface settlement, as long as the shaft capacities of the piles are not exceeded by the load transfer from the pile base to the shaft during volume loss.
Related Files
Fig 3 – The settlement of a single pile close to the tunnel with volume loss, also showing surface settlement at the pile
Fig 4 – Zone of influence around a tunnel in which a potential for large pile settlement exists
Fig 6 – Percentage of total pile load carried on the pile shaft with settlement (percentages refer to volume loss; curve numbers refer to pile locations shown in Fig 4 and 5)
Fig 7 – Normal and shear stresses recorded on a pile segment with pile settlement attributed first to pile driving and then volume loss
Fig 2 – Diagram of the centrifuge model and instrumented pile
Fig 1 – Cross-section of the two CTRL tunnels underneath piled foundations of a bridge in East London
Fig 5 – normalised pile base loads with volume loss


