
Authors are Pål Drevland Jakobsen 1, Eivind Grøv 2, Amund Bruland 3, and Sondre Gjengedal 1. 1 The Norwegian Geotechnical Institute (NGI), Trondheim, Norway 2 SINTEF Community, Trondheim, Norway 3 The Norwegian University of Science and Technology (NTNU), Trondheim, Norway
INTRODUCTION
The Norwegian University of Science and Technology (NTNU) has since the early 1970s published prediction models for estimated production rates and time consumption and costs for rock works. The NTNU models are openly available for the tunnelling industry and are based on empirical relations between geological data and measured performance data. The empirical data originates mainly from actual tunnel projects and are collected through contributions from contractors and tunnel owners. The data are also correlated to field and laboratory studies executed by PhD and MSc students at NTNU.
The initial NTNU prediction models with versions in English language date back to 1975 and 1983, respectively. The current range of updated NTNU prediction models now include versions for hard rock TBM tunnelling (Macias, 2016; Bruland, 1998), rock quarrying and cut blasting (Olsen, 2009) and models for Drill and Blast (D&B) tunnelling (Zare 2007a, b; Rønn 1997). The primary goal of these models has been to serve as guidelines for planning of works, project scheduling and cost estimates. The prediction models are neutral, unbiased and constitute a basis for use in many aspects. In recent years, one important aspect has been to provide an independent base for disputes on tunnelling, i.e., construction time or advance rates, and the NTNU models are still frequently used and referred to by the tunnelling industry.
Since the early development of the NTNU models the tunnelling industry has continuously improved and the models have been updated several times. The main background data that support the current models are primarily from the 1990s and early 2000s, mainly concerning single tube tunnels constructed in rural areas of Norway.
Tunnelling activity has gradually moved away from rural hydropower tunnels and traffic tunnels, respectively, to focus more on urban underground infrastructure in the major cities.
Urban dual-tube road and rail tunnels today are often excavated with alternating tunnel faces, which means that one machine package and tunnelling crew – consisting of one drilling jumbo plus loading, hauling, and rock support equipment – alternating from one tunnel tube to the other during construction.
The time expenditure related to moving equipment and work force, from one face to the other, has great influence on the performance and production capacity. If the planned performance at one tunnel face is interrupted, e.g. due to increased need for pre-excavation grouting (PEG) or extensive rock support, this will influence the availability of the equipment on the alternating tunnel face. Furthermore, modern infrastructure tunnels in Norway have seen a steady increase in the quantity of rock support and PEG used in design, and so more time expenditure on each blast round. The impact of such incidents is not a part of the current NTNU prediction models.

The productivity in the Norwegian tunnelling industry has thus changed since the current model development.
The overall productivity has seen a descending trend due to a variety of reasons and factors (i.e., as mentioned above) with cumulative impact on the efficiency of producing one linear metre of tunnel.
For the onshore construction industry in Norway, the productivity rate decreased by 10% over 2000-2018 (The Statistic Norway). The tunnelling industry, which is a part of the onshore construction industry, is included in this index. The reason for this decline on a national level is complex, but it is clear that for tunnelling the rock mass properties of Norwegian bedrock has not changed and cannot be the reason for the decline in productivity. In fact, the modern machine fleet, such as drilling jumbos, and loading and hauling machinery, and explosives, have seen incremental improvements and are today capable of much higher production capacity, in linear metre of tunnel per time unit, compared to the year 2000. It is, therefore, relevant to ask how well the NTNU prediction models currently fit to the current production trends.
The NTNU prediction models are presently being updated to better fit the modern tunnelling trends in Norway. The study presented here is part of this ongoing work and shows how well modern D&B tunnel design is reflected by the model for tunnel blast estimation. In this paper, a review of the prediction models published by Zare (2007a, b) and Rønn (1997) is compared with new data from 13 recent tunnel projects in Norway. The aim of the paper is to demonstrate that the empirical methodology behind the prediction model is still highly relevant, but some further improvements and additional empirical relations are suggested to enable the model to better cope with the recent 16 years of development in technology, equipment, and blast design.
BLASTABILITY INDEX AND ASSOCIATED NTNU PREDICTION MODELS
The NTNU prediction model for underground blasting consists of three main elements: (a) blast design; (b) advance rate; and, (c) costs. The model has been developed to provide a tool and methodology for economic dimensioning, choice of alternative solutions, time planning, cost analysis, tender, budget and cost control, and choice of excavation method and equipment selection.

The models are published in open access project reports, with corresponding spreadsheet software for calculations.
The current version of the NTNU prediction model for D&B tunnelling is the version modified by Zare (2007a, b) and builds upon the original work derived from earlier and less sophisticated models developed since the mid-1970s.
NTNU’s D&B tunnelling model estimates the theoretical minimum necessary number of charge holes and the explosives consumption needed per blast round during excavation. The actual number of holes and explosives consumption is decided by the tunnel crew, which tend to include extra charge holes and explosives in an effort to achieve better blasting results or production rates. Some of the reasons for including extra charge holes are elaborated upon in the Results and Discussion section of this paper.
The main features of the D&B model is that it is empirically-based and relies upon a description of the rock quality, the explosives, equipment specifications, and the size and geometry of the tunnel face, as is common for many prediction models in general (Holmberg, 1982; Persson et al., 2001; Yang et al., 2005; among others). In 1975, a preliminary NTNU prediction model was prepared that was based on two charge hole diameters and two charge hole lengths, both in typical use by industry, namely: the 34mm-diameter holes with 2.1m drill hole length; and, the 45mm size holes with 2.7m drill hole length. An empirical relationship of necessary drilling and specific charging was prepared for tunnels from 12m2 to 80m2 tunnel cross-sections (collaring area).
A key input parameter for the NTNU prediction model is the Blastability Index (SPR), which was introduced in 1988 to enhance the model performance and also to demonstrate the fundamental understanding that different rock types require different specific charging. The index was originally developed for surface bench blasting and shows a relation between the quantity of explosives (kg/m3) required to break a given volume of rock into a certain degree of fragmentation. Originally the fragmentation criteria concerned achieving a size distribution where 50% of the blasted rock size is less than 250mm sieving size. The SPR index is estimated based on Equation. (1).

There are also several other blastability indexes in the literature, applying numerous different properties and rock characteristics in their correlations. A review of Lislerud (1990) presents and compares several blastability evaluators for surface and tunnel blasting, including: Johanessen (1973); Bergh-Christensen (1968); Lilly (1986); Kuznetsov (1973); Cunningham (1982); Rustan et al. (1983); Singh and Sastry (1987), among others. These models are not further elaborated herein, as the aim of this paper is not to compare them, but to evaluate a potential new trend in Norwegian tunnelling with respect to the NTNU model.
Incorporation of SPR into the NTNU prediction model is based on a qualitative description of the index.
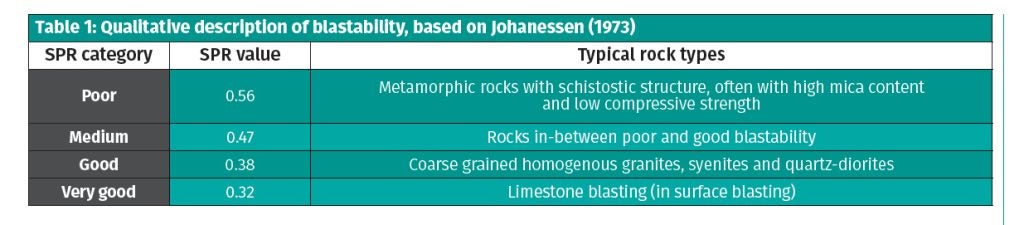
Johanessen (1973) was the first to describe a simple qualitative description of blastability for Norwegian rock types – a description still in use for its D&B tunnels. The basis was extended by Log and Moger (1997) who collected SPR laboratory results from a total of 135 rock samples, mainly from Norway (see Figure 1). In the NTNU prediction model, the classification of SPR by Johanessen is simplified into blastability categories where simple, yet appropriate, key words on typical geological conditions are used to differentiate between classes, as shown in Table 1.
Compared to other blastability indexes, there are two main negative arguments against the SPR index that are often mentioned in the literature: first, it demands special equipment to measure P-waves to obtain input data; second, it does not directly incorporate rock mass properties, for example, joint spacing and orientation which have been shown to affect blastability.
Early on, Selmer Olsen (1964) stated that mica-rich rock types (> 30% mica) and with a schistose structure along the mica layers are especially difficult in terms of blastability. Palmstrøm (1997) found that three measurable parameters influence rock blastability: Brittleness Value (Dahl et al., 2012); orientation of the excavation in relation to geological structure; and, mica mineral content. To some extent, these elements can be explained by anisotropy of rocks, which is reflected well in the SPR formula. However, the SPR do in-fact have an indirect relation to these properties as, to some extent, joint spacing and the tunnel versus geology orientation effects the P-wave values. The wave measurements, though, can be obtained by simple and portable laboratory methods, which can also be installed on-site if required.
The first extended version of NTNU model was published by Rønn (1997), updating it with new data from then recent developments within the tunnelling machine fleet. New loading and hauling equipment and capacities were introduced, and charge hole diameter expanded to include 45mm and 64mm drill holes. Bulk slurry emulsion explosives were introduced, in addition to ANFO and cartridge explosives.
Blast design details encompassing tunnel crosssection shape, cut design, ignitor sequence and contour rows were also introduced. In addition to the design of the blast cut, the detailed design of the drilling pattern included the charge holes in the contour, holes in the row nearest the contour, the lifter holes as well as the stopers. The NTNU prediction model proposes charge hole spacing for all these holes based on the three rock blastability categories: poor, medium, good (see Table 1).
The output of the prediction model would give the total number of holes required to be drilled and charged to produce one blast round.
The modern version of the NTNU prediction model is that of Zare (2007a, b), which follows the same methodology and is still very similar to the version of Rønn (1997), but with updated empirical relations on crew skill level, new equipment, and cost. The standard charge hole diameter was increased from 45mm to 48mm, and new average values from tunnelling datasets were employed in the analysis.
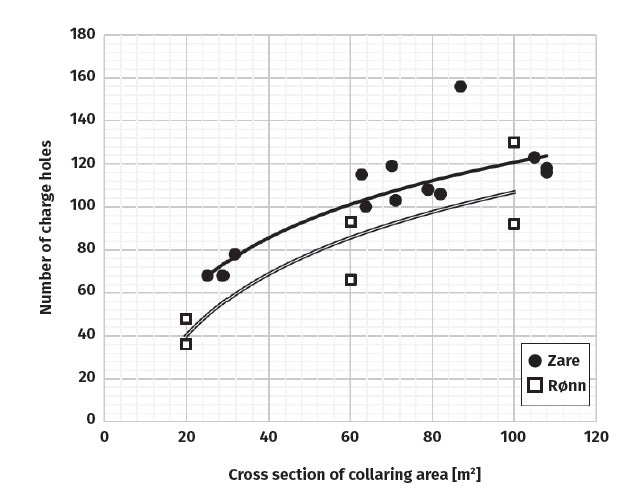
Figure 2 shows the difference in data points that constitute the base for the Rønn (1997) and Zare (2007a, b) models, respectively. The dataset of both models shows a relatively wide scatter and may not necessarily follow an ideal trend, but the trend line became quite distinct in the latter version of Zare (2007a, b). The latter essentially shows that tunnel blast designs in late 1990s towards early 2000s relied on more drill holes than in the Rønn (1997) model, and the NTNU D&B model was adjusted accordingly.
Parameters to be determined prior to estimation by the Zare (2007a, b) version of the NTNU D&B prediction model are: rock mass blastability (SPR); drill hole specifications (length and diameter); crew skill level; and, actual tunnel cross-section (m2).
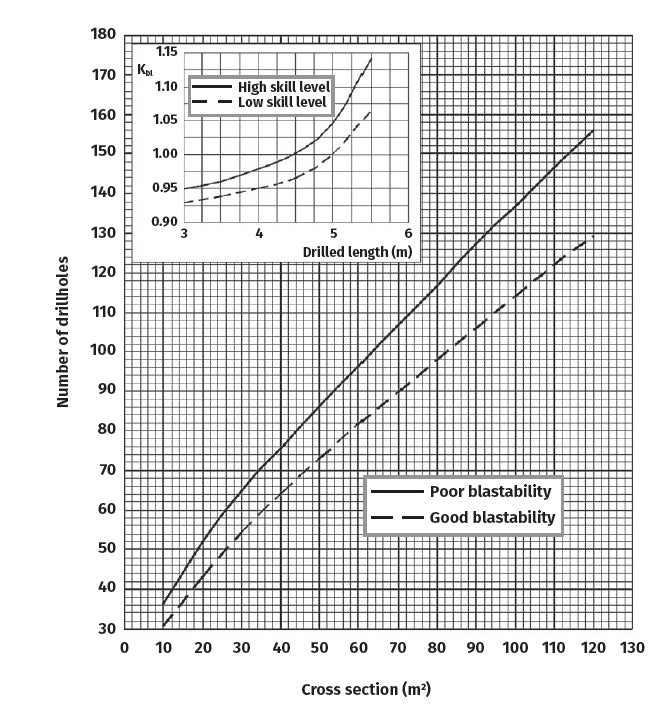
Figures 3 and 4 show the output from the NTNU model for the predicted number of necessary 48mm-diameter drill holes for various tunnel cross- sections and SPR values, respectively (excluding large uncharged holes in the cut), for a standard blast round. The NTNU model uses the 5.0m-long drill length for a standard blast round, which can be compensated for the actual drill hole length and crew skill level in actual projects via a correction factor (Kbf). The designated blast round design can then be further used for estimation of construction capacity, e.g., measured by linear metres of tunnel produced per week on average, and, subsequently, the total construction time and cost estimates for the entire length of the tunnel.
Figure 4 shows that the current version of the NTNU prediction model estimates standard specific charge consumption in the range of 1.05 kg/sm3– 3.25 kg/sm3, depending on SPR value and cross-section size of the tunnel ranging from 10m2 to 120m2 collaring area sizes. In the model, the pull (ratio between drill hole length and achieved blasting depth) is 91%, while the empirical database that the model relies upon obtained 95% pull, to be conservative and so not over-estimate the performance.
Since 2007, the NTNU D&B prediction model has not seen any major official updates. A few studies have been conducted to evaluate its validity and relevance (Zare & Bruland, 2006; Tufte-Rødberg, 2019).
RESEARCH METHODS
New specific charging (kg/sm3) and drilling data (number of charged holes per blast) from 13 recently completed D&B tunnelling projects in Norway, undertaken over 2016-2022, were analysed. Project selection aimed to make available a variety of D&B conditions with different geology, equipment, operational crew, tunnel cross-sections, and lengths. In the datasets, slurry bulk emulsions are used as the main explosive type.
The new datasets are compared to the historical datasets reported in the literature, particularly the datasets from Zare (2007a, b) which presents averaged datasets for both specific charging and drilling from 14 older Norwegian tunnels (see Figure 2) – 11 of which used slurry emulsion and three had ANFO as the main explosive type. The SPR values range from medium to good. Tufte Rødberg, (2019) presents drilling data from eight different tunnelling projects in Norway. A total of 55 individual blast rounds are included in that study with SPR in range from poor to medium. The datasets are included to show the potential spread of the input data from such tunnel projects.
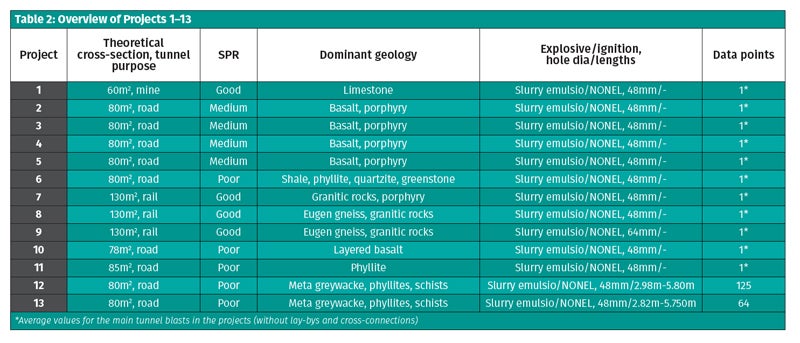
The 13 new tunnel datasets are presented in Table 2, which summarises the main specifications from the project sites.
Projects 1–11 of the latest 13 projects studied represent averaged datasets for both specific charging and drilling, where the input values are averaged for the whole blast database. These datasets contain a single averaged value for the main tunnel blasts alone and are thus structured equal to that of the data of Zare (2007a, b) for comparison with older tunnelling data.
Note that the specific charging is calculated from the total weight of explosives used in the blast divided by the average solid volume of the blast round (actual collaring area times drill hole length—including the volume due to the angle of the contour). The specific blast design is thus not presented and the details on the cut design, the firing sequences and tunnelling cost will not be elaborated and only mentioned in brief where relevant.
The main bulk of the data originate from Norwegian road tunnels that have a theoretical cross-section size of 80m2. Ideally, a more evenly distributed and wider spread of tunnel cross-sections would have been preferable. The data collection is also based on a charge hole diameter of 48mm, which is the industry standard at present.
Projects 12 and 13 are presented with more detail, including a differentiation between various tunnel sizes along these tunnel lengths. The actual collaring area for the drilling is normally slightly larger than the theoretical tunnel size due to the space requirement of the equipment and due to angling of the drill holes. Furthermore, the tunnel size of cross-adits and emergency lay-bys within each tunnel project provide supplementary tunnel sizes even though the tunnel class is the same for most of the projects. These datasets are also averaged and structured like that of the data of Zare (2007a, b) for comparison.
The two projects were excavated in the same rock type and together contain a total of 189 individual blasts, distinguished into 17 cross-adit blasts, 139 main tunnel blasts, and 33 lay-by zone blasts.
RESULTS AND DISCUSSION
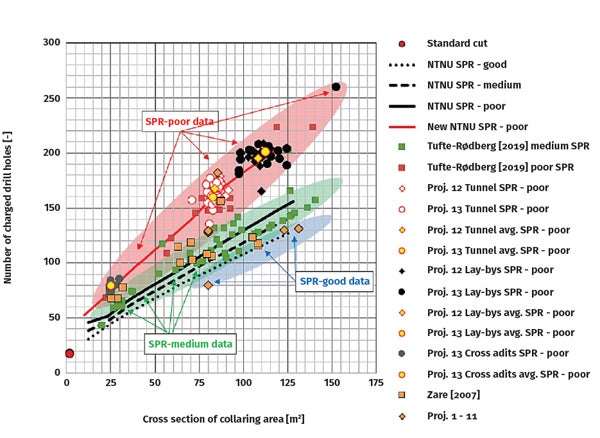
The drilling data output of the NTNU D&B prediction model is presented in Figure 5 together with data from most recent projects studied (Projects 1–13), the data of 14 prior projects studied by Zare (2007a, b), and eight by Tufte Rødberg, (2019).
The detailed data from the study of Projects 12 and 13 are differentiated for main tunnel blasts (white), emergency lay-by blasts (black) and for cross-adit blasts (grey). The overall spread of the datapoints in Projects 12 and 13 demonstrate the resulting variation due to adjustments of the blast design within a given tunnel project during the construction phase.*
The figure shows the NTNU model trendline used with an estimated 5m drill length. It demonstrates that recent development in Norwegian tunnelling practice has resulted in an increased number of charged drill holes used in the blast design compared to the NTNU pre- diction model of Zare (2007a, b). This trend is indeed quite similar to the differences in the data of Zare (2007a, b) and Rønn (1997) in Figure 2.
In Figure 5, the lower bound of required charged drill holes is represented by the drill holes needed in the cut, here exemplified by two standard cuts (F and S) reported by Fauske (2002). These cuts typically contain 21–25 boreholes, of which 17–18 are charged. This lower bound seems to fit quite nicely with the trendline of the SPR-good data of the NTNU model. The medium and poor trendlines are seemingly given additional boreholes that cause a small vertical shift of the graphs.
By comparison with the actual data, it is clear that the model’s estimation of necessary number of charged drill holes is essentially much lower than the majority of the new datapoints from Project 1–13, and also compared to the data of Zare (2007a, b) and Tufte Rødberg (2019), respectively. There are several reasons for this difference and some of the main factors are included in the trendline for the ‘new NTNU SPR–poor’ model, in Figure 5.
One reason for this difference is partly due to the drilled length used in modern blast rounds where common practice, as in Projects 1–13, is to utilise longer drill hole lengths than the baseline of the NTNU model, with typical drill length values in the range of 5.5m–5.8m. For the road tunnel profile of approximately 80m2, Figure 5 shows that the NTNU model estimates a need of 100–115 charged holes for a 5.0m drill length blast in SPR medium–poor. If the drilled length is increased, the number of holes must be slightly increased to compensate for the drill hole deviation and larger burden in the deeper end of the blast (Zare 2007a, b). The baseline NTNU values must thus be increased by 10%–15% to enable a comparison with the majority of the new datapoints of this study. This upscales the NTNU model estimates to 110–140 of 48mm charge holes for a road tunnel profile of 80m2.
Another reason for this difference was disclosed by Tufte Rødberg (2019), emphasising that the average drilling collaring area starts outside of the theoretical cross-section contour, causing an increase of the tunnel cross-section size by 8% on average. This trend can be observed in Figure 5 for Projects 12 and 13, displaying almost consistently larger collaring area (white shaded datapoints) than the theoretical 80m2 size. The spread of the white datapoint clouds shows that the collaring area for these two projects range from 71m2 to 95m2, with an average collaring area of 83.5m2 (4.3% larger than theoretical). This increase of cross-section area has some practical implications for the blast design.
Compared with the theoretical size, a larger collaring area essentially enlarges the tunnels from the theoretical specifications and produces a longer contour perimeter and a larger blast volume (sm3), which increase the number of required charged drill holes in the blast design.
Collaring enlargement has particular influence on road tunnel blasting in Norway as regulations (Vegnormal N500, 2022) state that the contour hole spacing shall not exceed 0.7m for normal contour conditions, and not more than 0.5m for smooth blasting requirements, which contractually overrule the suggested spacing in the NTNU prediction model.
The regulations also set requirements on blast holes adjacent to the contour (second contour), with shorter spacings and less charging density. These requirements oblige the blast designer to utilise additional charged holes than suggested by the NTNU model for the blast design. In Figure 5, for the white and black datapoints of Projects 12 and 13 the contour holes and second contour holes represent 45–50 of the total quantity of holes. This is some 10–15 additional drill holes than predicted by the NTNU model. The baseline NTNU values must thus be increased further, to 120–148 of 48mm charge holes for a road tunnel profile of 80m2 in the SPR medium–poor range.
Another reason for the difference in number of charge holes is due to a common tunnelling practice in modern blast design in Norway with road and rail tunnels having parallel drainage ditches along their entire lengths, such as in Projects 1–13. The ditches are commonly included in the main blast to save costs and overall construction time. Each ditch usually requires additional charged holes in the invert, typically in the range of 3–5 charge holes per drainage ditch. In the white and black datapoints, in Projects 12 and 13 datasets, the tunnels were designed with two such ditches, adding 6-10 additional charge holes in each blast round. The baseline NTNU values must thus be increased to 126–158 of 48mm charge holes for a road tunnel profile of 80m2 in medium to poor SPR rocks.
All three of the abovementioned adjustment factors are added to the SPR–poor model to demonstrate the increase in number of drill holes that results in the prediction model of the ‘new NTNU SPR–poor’. It is evident that the new NTNU SPR–poor trendline plots relatively well within the cluster of SPR–poor datapoints of Project 1–13.
The corresponding used specific charging values are plotted in Figure 6.
The upper bound of required specific charging is represented by the blast charge in the cut, characterised for two cuts (F and S) reported by Fauske (2002). The average specific charging reported by Zare (2007a, b) and Projects 1–11 are shown in orange markers, while the new data from the study of Projects 12 and 13 are shown in yellow markers for the average specific charging.
The yellow marks – representing the average values for each of the categories (white, black and grey) – are comparable to how the orange data of Zare (2007a, b) and Project 1–11 are structured. The individual blasts for tunnel blasts (white), emergency lay-by blasts (black) and for cross-adit blasts (grey) are seen in the background.
The overall spread of the datapoints in Projects 12 and 13 demonstrates that are variations and adjustments in the blast design for a project during construction. The spread of the data for the tunnel blasts (white: 2.2 kg/ sm3–3.4 kg/sm3) might be due, for example, to local variations in geology along the tunnel length, but also due to optimisation efforts carried out by the tunnelling crew.
This results in a relatively wide variation envelope for the expected range of specific charging values used in practice. For instance, on Project 12, the number of blasts with specific charging is relatively ‘flat’ within the range 2.5 kg/sm3–3.1 kg/sm3. The average value for all blasts could be given as 2.86 kg/sm3 but due to the large range of variance the average value does not necessarily provide the best overview of the situation. This fact is important to consider when comparing the averaged values between various projects, e.g., across Projects 1–13 in Figure 6, or other datasets.
Regardless of this fact, Figure 6 demonstrates that the estimation of necessary specific charging in the NTNU model is significantly lower than the majority of the new datapoints in Projects 1–13. This trend is consistent with the additional number of charged drill holes actually used in Norwegian tunnelling practice (Figure 5) and suggests that the quantity of explosives used in modern tunnel blasts is much higher than the NTNU model predicts, regardless of the SPR.
Fauske (2002) reported on the early stages of use of emulsion bulk explosives in tunnel blasts in Norway and Sweden during the early 2000s. During that time, the 80m2 tunnel test blasts involved 0.9kg explosives per metre length of drilled borehole, leading to a charge weight of around 4kg–5kg per blast hole and a specific charge of 1.4 kg/sm3–1.5 kg/sm3, indeed very similar to the NTNU model.
In Projects 12 and 13, it is evident that the main bulk of the specific charge data is within the range 2.5 kg/ sm3–3.1 kg/sm3. Consequently, the main blast holes must be charged with much higher quantities of explosives than during the early 2000s for these figures to add up.
The average charge weight per blast hole in modern blast design is evidently between 9kg-11kg of explosives. The reason for the significant deviation between the NTNU model and the project data in Figure 6 is, therefore, also due to a change in the charging strategy in tunnel blasts today, where the tunnelling blasts are designed with an “over-consumption” of explosives compared to older charging strategies.
This is further supported by the ‘New NTNU model’ in Figure 6 visualising the NTNU SPR–poor trendline with a 60% increase in explosive consumption. It has not been possible to determine why this occurs, but several reasons might contribute to the observed increase of explosives consumption.
A minor part of the over-consumption can be explained by the explosive type. In Norwegian D&B tunnelling, most blast rounds are charged with slurry emulsion bulk explosives. Zare (2007a) reported that, under the assumption of approximately the same charging density, the specific charging for emulsion is the same as for ANFO, and by charging with bulk explosives, there will be waste and unintentional over-consumption of explosives. This over-consumption is deemed to comprise a 10% increase in explosives consumption compared to the NTNU model.
Another reason might be a lack of blast-induced vibration regulations in some of projects or in parts of the tunnel.
A third reason might be a desire for higher pull percentage and to avoid re-blasts due to remaining rock within the tunnel profile.
A fourth reason might be a desire to achieve smaller fragmentation sizes of the rock and thus easier loading conditions, which might yield overall faster tunnelling rates.
Further, it is seldom that the uncharged length exists in Norwegian D&B tunnelling, meaning that the drilled holes are generally filled along their entire length. This, together with ignition system (NONEL vs. electronic detonators) should be investigated further.
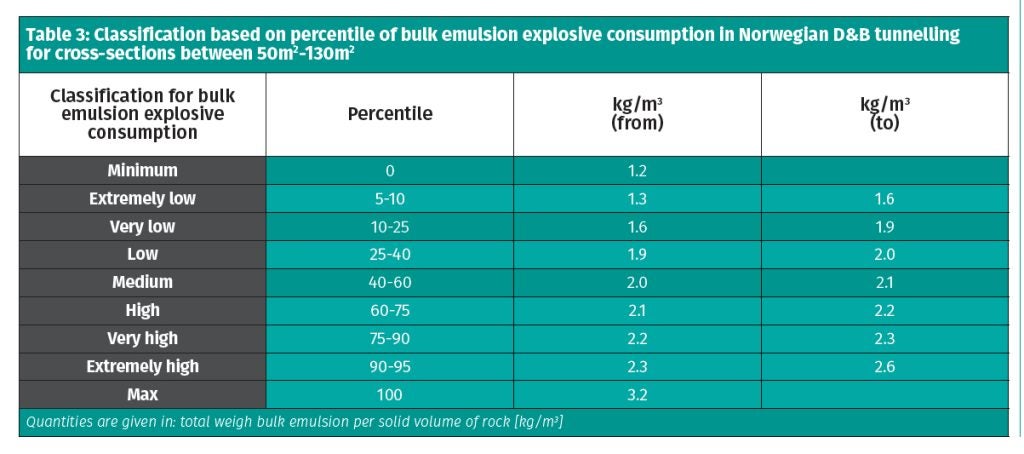
Based on the data collected for this study, a new proposed specific charging classification is presented in Table 3. The classification is based on average values for the D&B tunnelling projects in Norway and is deemed applicable for cross-sections between 50m2-130m2 – for which it is expected that the majority (80%) would fall within 1.6 kg/sm3–2.3 kg/sm3 specific charging on average. Note that the spread of the actual specific charging per blast round could vary significantly, as is evident in Figure 6. The classification should not be used for smaller tunnel cross-sections due to large variation in the data catch from tunnels with cross-sections of less than 50m2, and much higher specific charging levels should be expected to be considered.
CONCLUDING REMARKS
The NTNU prediction model for D&B tunnel design has been validated versus data from ongoing and recently completed tunnelling projects in Norway. Input factors such as necessary number of charged drill holes and specific charging has increased since the last revision of the model. However, the shapes of the trendlines are similar to the 2007 version of the model.
During the last decades the cost of explosives has been small in Norwegian tunnelling projects compared to the man-hour cost and machine cost. The increased number of charge holes and the quantity of explosives can be explained with the contractor’s desire for lower overall tunnelling costs. The current cost incentives drive towards higher tunnelling rates by achieving a higher pull, few or no incomplete blast rounds, and eliminating the probability of remaining rock protrusions beyond the theoretical tunnel profile, all of which lead to higher explosive consumption. If the relative cost of explosives should increase then this trend might change.
The presented study suggests that the NTNU prediction model is still valid and applicable for use in the tunnelling industry. The model may appear too optimistic as current trends show both higher drill hole usage and higher specific charging per blast round in a studied selection of the most recent tunnelling projects. Some possible causes have been discussed above and suggestion for further updates are suggested, e.g., include ditch holes in the model for better conformity with actual tunnelling data.
The also suggests that the database does not cover the extremities on number of charge holes and quantity of explosives that may occur in use on projects, such as where geological conditions are on the extreme side of poor blastability. More studies and data are needed to help further represent ongoing developments and improvements in technology, and accounting for the latest regulations.
Another way forward to help improve the NTNU model is to further develop the SPR, or the way the qualitative assessment of ‘rock blastability’ is incorporated into the model. The SPR does not directly consider rock mass properties, such as joint and fissure densities, nor their orientation to tunnel alignment.
In principle, it is expected that closed joints and fissures with moderate spacing (10cm–20cm) will act as crack propagators for the explosives. Rock masses with no fissures and joints will be more dependent on the brittleness of the rock than jointed rock masses. Rock masses with open joints and fissures will also act as pathways for evacuation of the explosive gas, causing the rock mass blastability to become poorer. Incorporating such parameters might improve the output and the accuracy of the model, and other blasting predictions.
This paper was originally published online in Oct 2023 by Rock Mechanics and Rock Engineering journal on an open access basis under the Creative Commons Attribution 4.0 International Licence, funding for the CC publication provided by the Norwegian Geotechnical Institute. This version of the paper is slightly abridged and edited for space, and images have been adapted to housestyle. The original paper is at: https://doi.org/10.1007/s00603-023- 03585-9. The link for CC is: http://creativecommons.org/ licenses/by/4.0/